Workspace Overview
The workspace overview page can be accessed through the project selector dropdown, if a workspace is defined.
It provides a quick, high-level overview of the projects in the workspace scope.
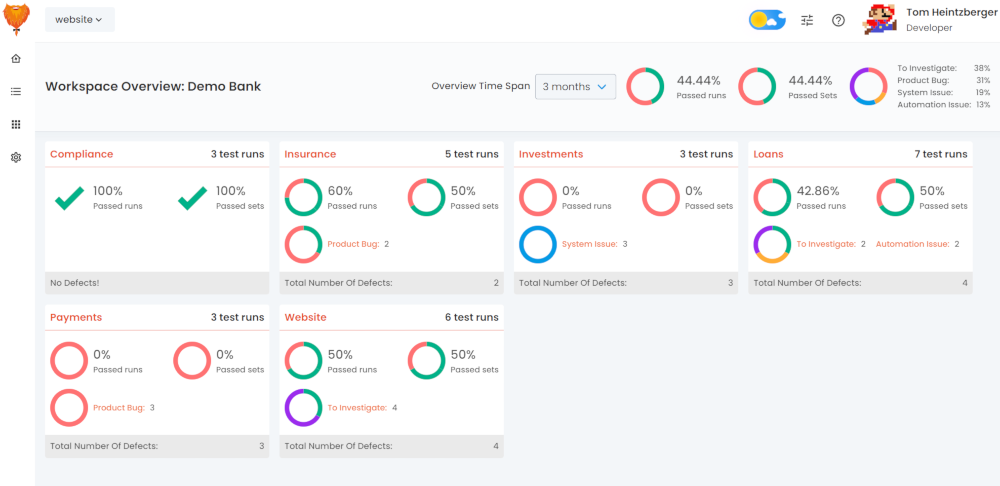
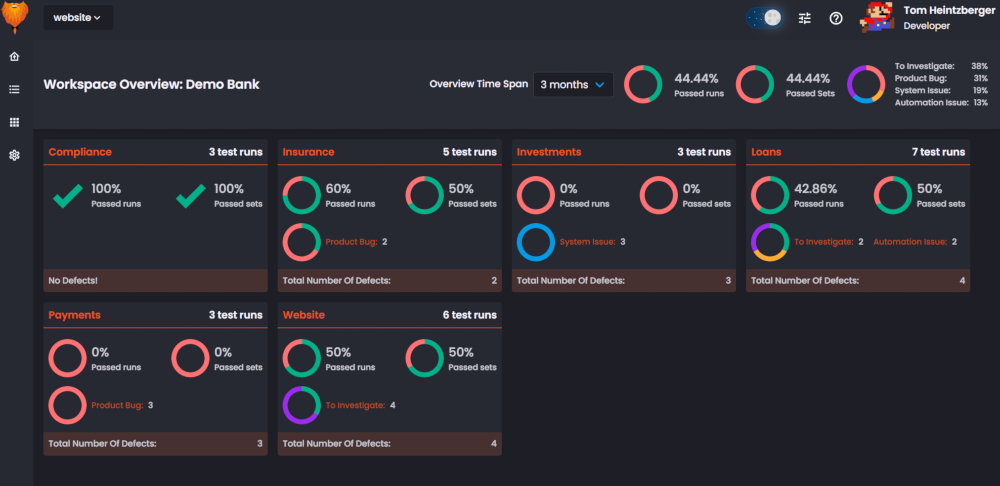
Overview header
The header bar contains the following elements:
- Workspace name
- Overview timespan: The time span dropdown is used to limit the age of test runs to be considered for the workspace overview.
- Test Run pass percentage: the percentage of test runs that have a status that equals 'passed' within the selected time span
- Test Set pass percentage: the percentage of test sets of which the latest run has a status that equals 'passed' within the selected time span
- Defect type distribution diagram: A donut diagram displaying the distribution of defects over the different defect type categories within the selected time span
Project cards
Project cards indicate the current status within a project:
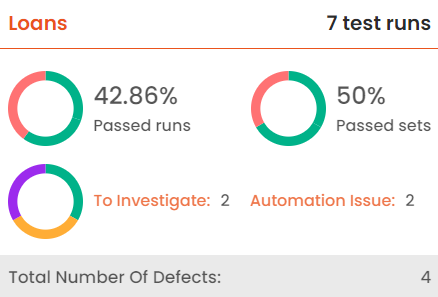
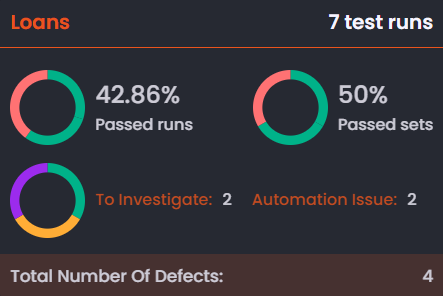
Project card information
The following elements can be displayed on the project card:
- Project name: The name of the project represented on the card. Clickable when the user is a member of the project
- Number of test runs: The number of test runs executed on this project in the selected time span
- Passed run percentage: the percentage of test runs that have a status that equals 'passed' in this project within the selected time span
- Passed set percentage: the percentage of test sets of which the latest run has a status that equals 'passed' in this project within the selected time span
- Defect type distribution diagram: A donut diagram displaying the distribution of defects over the different defect type categories
- Total number of defects: The total count of failed tests within the scope of this project in the selected time span
 Ask Orangebeard