Test Result Page
The test result page contains the output of a specific test. A test can contain steps and logs. Steps can be nested. When navigating to the test result page of a failed test, failed steps will be expanded an error logs will be displayed in full to allow you to easily analyze what happened.
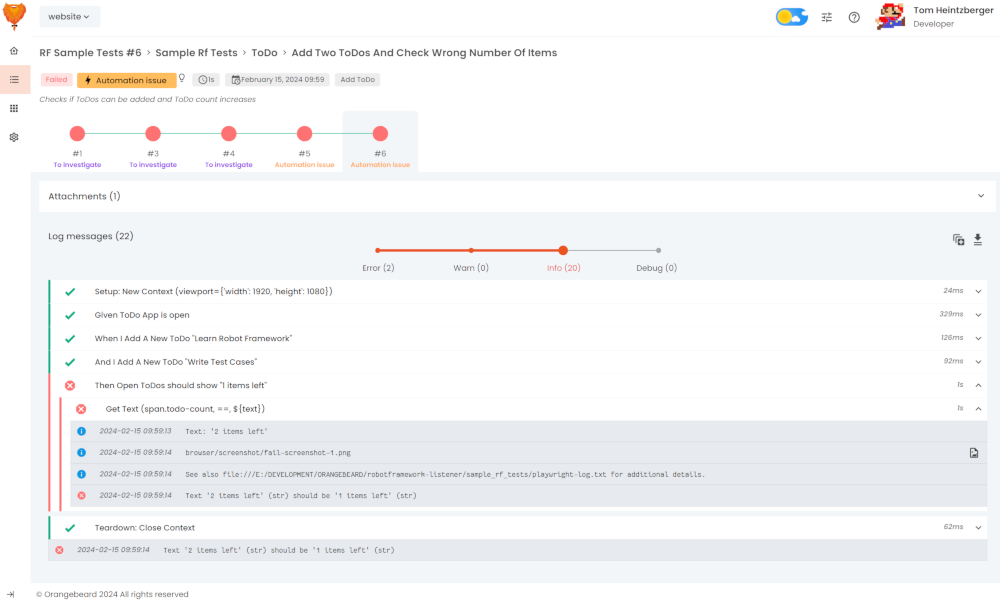
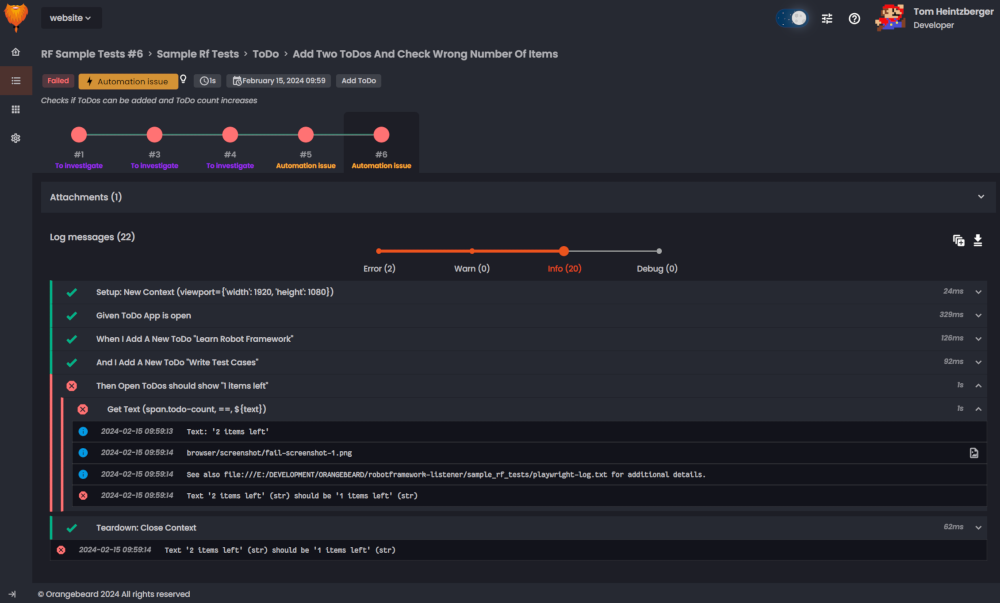
Test result header
The test result header contains information about the tests location in the test run. Containing suites are displayed in the test case path at the top of the page.
Quick info
Below the test case path, the following information is displayed:
- Status: Passed, Failed, Skipped or Stopped.
- Defect type (If a test has failed): To investigate (default), Product bug, Automation issue, System issue or Follow-up error. The defect type indicator can be clicked to view the details and/or update the defect analysis. this functionality is documented on the Test Run Results documentation page.
- Duration
- Start date & Time
- Attributes & Tags
Test description
The test description is a description that can be provided by the test runner, but can also be updated or amended by
Orangebeard users. To edit the description field, click the description (or, if no description is present, click the
add description link). The description now
becomes
editable.
The description field allows MarkDown for text markup or links. http(s):// links will be recognized automatically and
will be converted to clickable links by default.
Note that descriptions are linked to the test case instance.
- Descriptions are visible to all users
- Descriptions only apply to the test case instance they were added to and will not appear as or overwrite descriptions of the same test case in other test runs.
Test case history
The test case history bar shows the last 10 (or 9, plus the latest if you travel back in time) executions of the test case you're viewing. It provides information about historical status, flakiness, run time deviations, and defect classifications. When the user hovers a test execution in the history bar, the duration of that execution is displayed.


Timeline
When the current execution is not the last or before-last execution, the timeline will show the selected run, and the 9 runs that preceded it. Three dots () between the before-last and last execution in the timeline indicate that there are executions between the currently viewed and the most recent execution.
Status colors
The timeline shows different colors for different statuses. Green for passed, red for failed, grey for skipped and yellow for stopped.
Skipped executions are tests that were reported as skipped by the test runner (Skipped at run-time). If a test case was not executed at all, it will be missing from the timeline. The execution sequence numbers will miss an increment - e.g. The test case in the timeline bar above, was not executed in runs #2184 and #2187 - in such cases.
Defect types
When a test has failed, its analyzed defect type will be displayed in the defect type's color below the failed test case.
Speed icons
When a specific execution is slower or faster than anticipated, the timeline shows a tortoise or a rabbit icon. The icon is displayed if the execution time is more than 10% faster or slower than the average of the previous 3 passing executions.
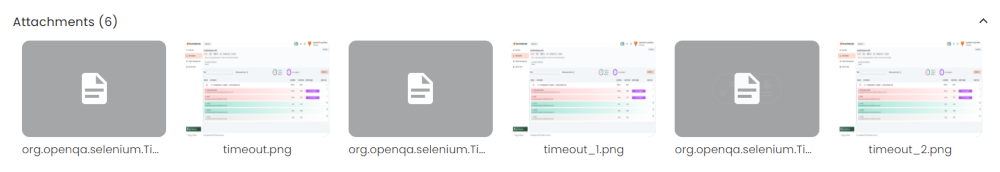
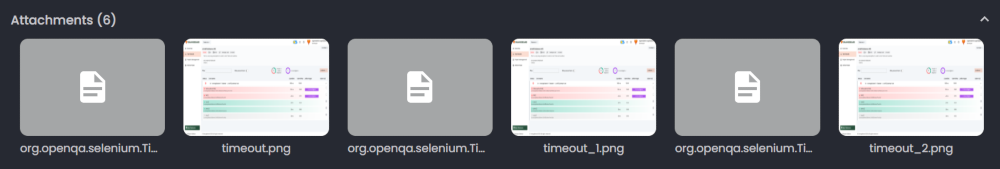
Attachment browser
The attachment browser provides quick access to all attachment files that were uploaded with the current test result. The attachment browser is collapsed by default. To display its contents, click the button on the right.
To show a large preview of the attachment, when hovering over the thumbnail, click the
icon. This will open a large preview of
the attachment. In case of image attachments, the lightbox will provide buttons to download the file, or display it in a
new tab, allowing to view the full resolution.
To download attachment files immediately from the attachment browser, hover over the attachment's thumbnail and click the
icon.
Steps and logs
The steps and logs view shows in-depth results of the test case. Any information that was sent to the listener api is displayed in this view.
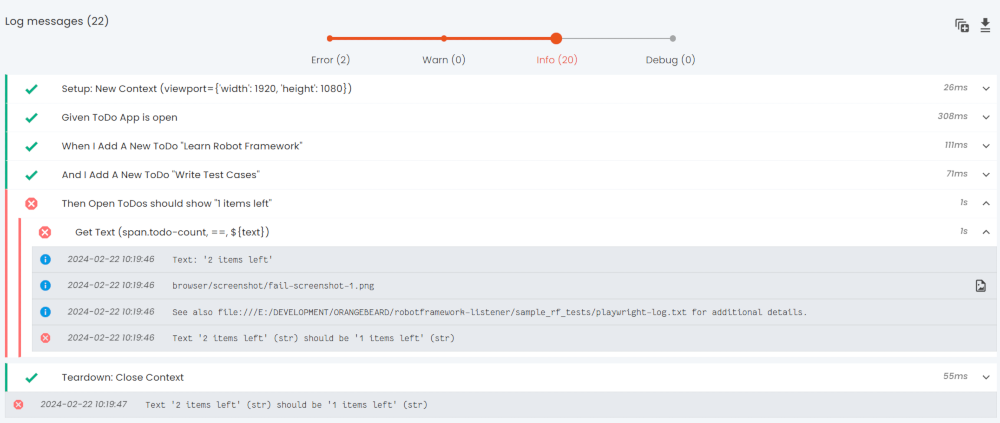
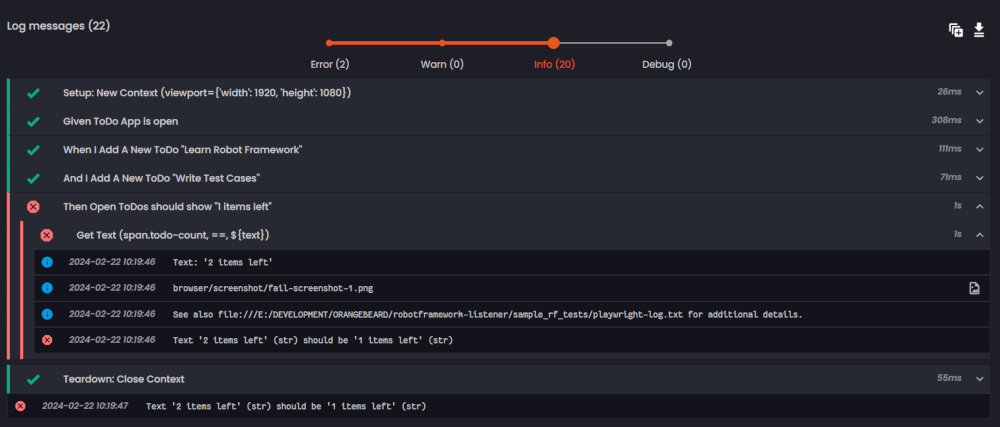
Log level slider
At the top of the log view, the log-level can be filtered by moving the slider. By default, it is set to Info, meaning that logs with levels Info, Warning and Error are displayed, and logs with the Debug level are hidden. To display debug logs, move the slider to the right, to show only warnings and errors, or just errors, move the slider to the designated level.
Quick actions
At the top-right of the steps and logs view, you will find two quick action buttons:
- The button will expand all steps and logs in view, allowing you to quickly read through all the information that was collected during this test. Clicking it a second time will collapse all entries.
- The button will download all log entries in a plain text file.
Log viewer
The log viewer displays all steps and logs in a nested structure.
Steps can be expanded and collapsed using the and
buttons.
Steps can be infinitely nested, so they can contain sub-steps and/or log items. Steps and items are sorted by their
timestamp.
Steps
A step container displays the following information:
- Status: indicated by one of the following status icons and corresponding colored left border:
Passed
Failed
Skipped
Stopped (Interrupted) - The step title
- Step duration
Logs
Logs are displayed as separate entries and provide the following information:
- Level: a log level indication by one of the following level icons:
Debug
Info
Warning
Error - Timestamp: the date and time of the log entry
- Log (preview): if the log is only one line and fits the preview, the entire log is shown. Otherwise, the log preview
will display a button on the right to display the
full log entry. When markdown or is logged, the preview will show a plain-text preview, in case of html, the top line is displayed. - Attachment(s): When a log entry has one or more attachments, these are displayed as file icons on the right side of the log(preview). Hovering the icon will display the file name. For commonly used file types, Orangebeard will display icons based on the mime type of the attached file.
 Ask Orangebeard