Test Run Results
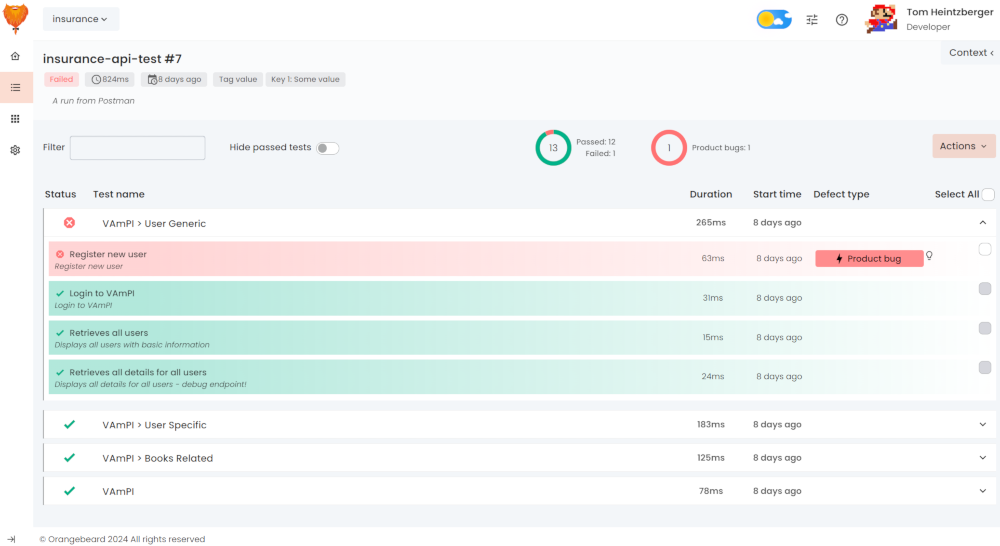
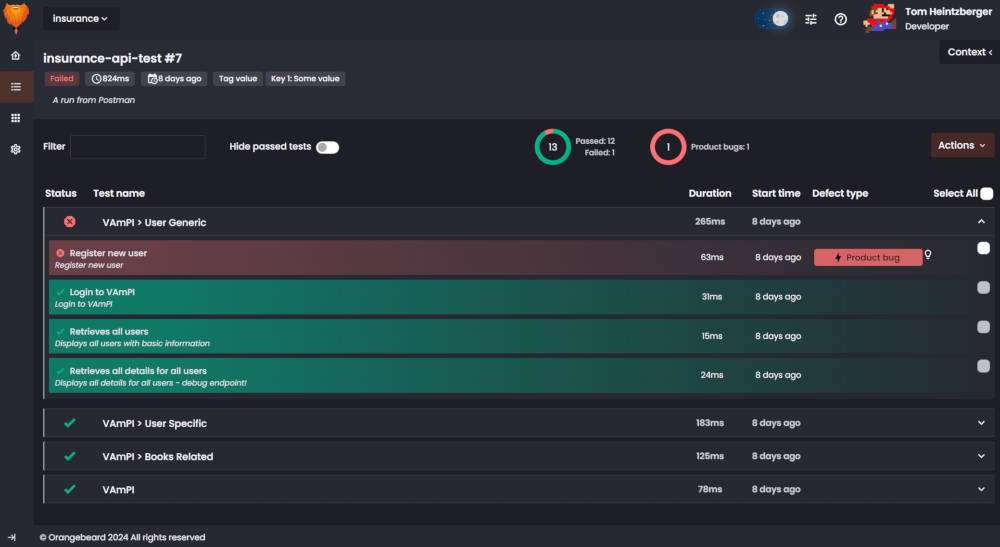
The test run results page contains information on all Suites and Tests within a test run, as well as a quick overview of and means to bulk-perform defect analysis.
Test run header bar
Top header
The top header shows the following information:
- Test run name
- Test run sequence number
- Assignee (if assigned)
- Status
- Duration
- Start date/time
- Attributes
- Test run description
Secondary header
The lower header contains information and actions related to the tests inside the test run:
- Filter: The filter input allows to filter suites and tests by text.
- Hide passed tests: This toggle allows to show only tests that have a status that is not
Passed - Pass/Fail donut: A donut diagram showing the pass/fail distribution. Counts are presented next to the donut. The number in the center represents the total number of tests in this test run
- Defect donut: A donut diagram showing the distribution of defect types within this run. Counts are presented next to the donut. The number in the center represents the total number of defects in this test run
- Actions menu: A drop-down menu with actions that can be performed in this test run
Actions menu
The test runs Actions menu provides quick access to the following actions:
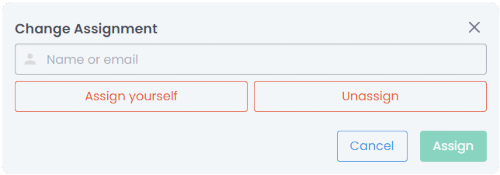
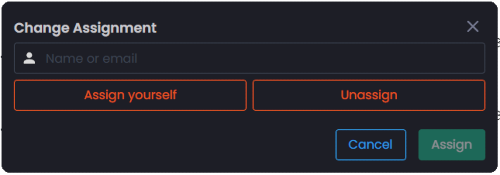
- Assign a user: Displays the Change Assignment Modal window from where a user can be assigned to the test run.
- Edit defects: Opens the Edit defect type modal for a bulk operation on all selected defects.
- Export full PDF: Downloads a PDF containing all test output.
- Export summary PDF: Downloads a PDF containing a short test run result summary.
Test run list view
The test run's suites and test cases are displayed in the list view. When the page is opened, all suites that contain only passed
tests will be displayed collapsed. To see their contents, click the suite name.
Suites that contain one or more failed tests will be expanded by default, allowing you to quickly determine where
test analysis should be done.
Passed tests/suites are displayed in a green colored bar, Failed tests/suites have a red bar, Stopped/Interrupted
tests/suites are displayed in a yellow bar and In Progress elements are displayed in a blue bar.
By default, the following information is displayed:
- Status
- Test name
- Duration
- Start time
- Defect type
Failed tests have a checkbox that can be used to mark them for bulk-editing through the Actions menu. The Select all box at the top of the list allows to select all defects at once.
When hovering over a suite, an anchor icon appears. Clicking this icon copies a link to the test run page, with the selected suite highlighted to the clipboard for easy sharing.
Edit defect type
When a defect type button is clicked, or at least one defect checkbox is selected and Edit defects is selected from
the Actions menu, the defect type modal window will open:
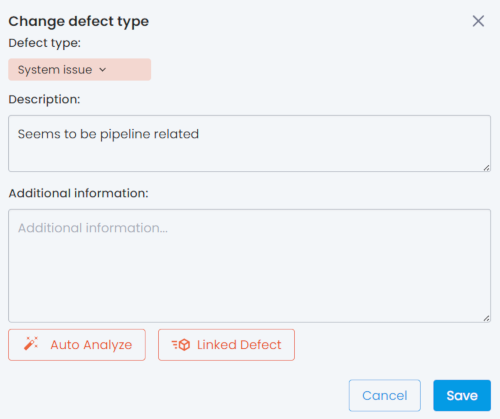
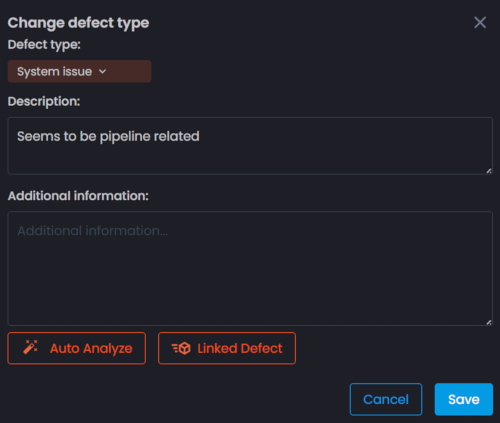
Defect type
The defect type dropdown, allows to select one of the predefined defect categories (and their global meanings, feel free to use them as you see fit in your context):
- To investigate: No category. To be analyzed
- Product bug: A problem with the SUT
- Automation issue: An automation problem, e.g. a flaky test, an outdated test, or incorrect test data
- System issue: A problem with the environment, e.g. a service that is down, wrong version of the SUT, or general instability
- Follow up error: This is a special type, indicating that this test failed as a result of a previous test failing. Defects with this type will not be processed for future auto-analysis.
Description
A free text input field where a defect description or detailed analysis can be noted. This field supports Markdown syntax.
Also, URLs will be rendered as clickable links.
If Auto-analysis is enabled in your project, the description will be copied to similar issues the analyzer
recognizes based on this analysis.
Additional information
A free text input field where a defect description or detailed analysis can be noted. This field supports Markdown syntax.
Also, URLs will be rendered as clickable links.
The additional information will not be transferred to new defects when auto-analysis bases new analyses on this specific defect.
Bulk update
By selecting multiple defects and clicking Edit defects from the Actions menu, the defect type modal window will open
in bulk update mode.
In bulk update mode, a warning is displayed in the Edit defect type modal:
Changing defect type and descriptions of # selected tests.
This indicates that you are bulk-updating test analyses. Note that a bulk update overwrites defect category and descriptions for all selected defects. This action can not be undone.
Manual auto-analysis
When the project has conservative auto analysis configured, the defect type modal will show the Auto Analyze button, allowing to request auto-analysis for this specific defect. The auto-analysis will search for similar issues and report and prefill the defect type and description if it finds a hit.
External defect registration
When a valid defect registration configuration is present, the Edit defect type modal window will display the Register Defect button. Clicking this button is a one-time action that allows to send the defect information to the configured external URL.
The registration call is expected to return a json response containing a URL to the created item. The json path to this URL,
configured in the defect registration defect registration configuration
is read when the response is received and the URL is stored with the defect.
The button in the modal window will now change to a
Linked Defect button, that when clicked, opens the created defect in a new browser tab.
Defect History
When defect information is updated (i.e. classified, described, auto-analyzed or an external registration is done), the previous version of the defect information is stored in the defect history. Clicking the history button shows any previous revisions and their authors.
Assigning a test run
A test run can be assigned to a project member from the Actions menu. When a test run is already assigned to a project member, it can be reassigned or unassigned by clicking the assignee's profile picture in the Test Runs page or in the Test run header bar.
 Ask Orangebeard